
Game Changers: Exploring Football Analytics


Eighteen months ago, I wrote a blog on how I have been using Apteco to answer questions posed in the Guardian's online weekly football statistics column. At that time, I'd had 6 of my contributions used. I thought I'd revisit this topic now that I've reached 25 contributions, (as well as numerous other contributed answers that don't get used) and share some of my thoughts on the techniques which I use regularly to solve problems. In this blog, I will illustrate these techniques and give you answers to the questions.
The data
At the end of each week's column, the Guardian's readers pose questions that they'd like answered in the 'can you help' section. The questions in this section can cover a huge range of topics including match results, performances of players and in-game events to name a few.
I have collected data on football match results only meaning that I can hope to answer only a subset of those posed. I update my data on an annual basis during each summer with the results from the previous season, so that I have all English league match data (from the first matches in 1888) up to the end of the most recently completed season for the top four divisions. This is a total of just under 206 thousand matches for 146 different teams.
The FastStats system is structured in such a way to allow easy analysis of results across a season, or for each team. So, each team will compete in one or multiple seasons. In each of those seasons, they will compete in multiple matches.
Useful derived variables / Predefined analysis
The match data set is fairly limited as it only contains information on the two teams, the date of the match, the division it took place in and the scoreline. In preparing the initial data set it was simple to add variables for goals scored and conceded and the season the match took place in.
Within FastStats, I've created several derived variables to more easily answer questions. Some of these are only used in one-off answers, others are much more useful and are used very regularly.
Here are some of the most useful ones I've created:
- Season points – each match is worth a number of points (0 for a loss, 1 for a draw, 2 for a win (pre-1981) or 3 for a win (post-1981). These match values can then be aggregated by taking the sum() to work out the number of points accrued in a season, using the Aggregation wizards.
- LeagueDivisionSeason – This is a selector variable that combines the league, the division and the season into a single variable (with 1200+ codes) which can be used to speed up analysis tasks and to also allow for easy grouping by the teams in a season (as required in variable 3 below). This was achieved by using the expression and create from cube wizards.
- Season position – the finishing position for a team in a season can be worked out by ranking the teams in each division (using variable 2 above) for a season by descending points. In practice, it is slightly more complicated than this as we need to be able to correctly differentiate the finishing order for teams that finish on identical points based on the criteria that were used at the time to order the teams. This can be done using the Numeric Banding wizard.
- MatchScore as a selector – this variable has the scoreline in the format of '1-0' with the team's goals first. This is used regularly in the sequencing questions in the Pattern Match functionality described in the next section and uses the expression and create from cube wizards.
- LeagueMatchNumber for season – some questions require looking at matches in particular rounds and to do this we need to know which match number each match was during a season. We can do this using the Numeric Banding wizard.
In addition, we can create analytical templates that drastically reduce the amount of time taken to create common pieces of analysis. There are two of these which I use all the time:
- Match details – this is a template of a data grid with team, season, date, match scores and results. This enables me to quickly cross-check whether the results that have been returned are correct and also to take copies of those to send in with answers.
- Season league table – this template comes in two parts. Firstly, there is a selection from which we can choose the season and the division, to return only the matches from a particular league season. Then, a cube on top of this contains all the information needed to quickly recreate a version of the league table. There are statistics for wins, draws, losses, points, position and goal differences. A second version of the underlying selection also allows for adding in a match number constraint so that we can produce mid-season league tables, for example.
Sequences
Probably the single most common type of question that appears is looking for record sequences of matches (or occasionally seasons) in which something notable has happened. Whether that is 'winning matches', 'goalless matches' or 'keeping clean sheets' all of them require the use of a similar approach using the Pattern Match functionality to find which team(s) have the records in particular examples.
For example, in the column on the 27th July 2022, this question came up:
“After seeing Wout van Aert complete three consecutive second places on stages at this year’s Tour de France, I immediately thought: what’s the record for a top-flight team finishing second multiple years in a row? (asks Joran Lamisse).
The immediate signpost to this being a question which lends itself to the Pattern Match functionality is the word 'consecutive'. A solution to this question in FastStats can easily answer the more general question of 'What is the longest run of seasons in which a team has finished in Nth place in the league?'. We can then hone in on the instances for 2nd place to answer the specific question above.
The first thing to note here is that could be entirely possible for a team to finish in the same place for 3 years in a row on more than one occasion and we really would like to be able to return all instances for which this has happened for each team. In this case, we want to return the length of the sequence of same positions on each transactional record (i.e. the given season is the start of 3 years in which a team had the same position for example). To make it as general as possible we want to look for our pattern on a variable that is 'finishing position' across all 4 divisions so that we end up giving each team a position for the season between 1 (winner of tier 1) and 92 (last in tier 4). The number of teams in the leagues has changed over the years, but you get the general idea. Creating such a variable is beyond the scope of this article but can be achieved with an expression.
Once we have the variable, we then simply need to order the seasons for each team and find the sequence length of seasons which have the same finishing position.
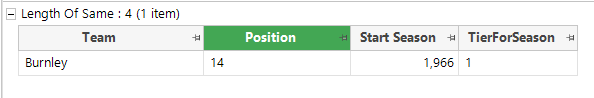
There have been 432 instances of a team having 2 consecutive seasons in the same position, and of those, 32 have then gone on to record a 3rd season in the same position. But only 1 team in the history of the league has so far recorded the same league position for 4 years in a row. This is quite clearly a record under threat this season as Manchester City strive for a 4th consecutive title-winning season.
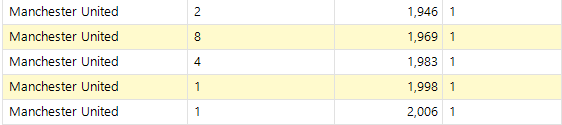
Since we have recorded this for every season we can quickly find the team that has finished in the same position for 3 years in a row the most times (Manchester United 1st starting from 1998 and 2006, 2nd starting from 1946, 4th starting from 1983 and 8th starting from 1969).
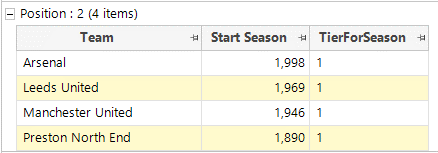
Finally, we can easily pivot the data to answer the original question about runners-up for 3 consecutive years to show that it is held jointly by 4 teams (Preston North End from 1890, Manchester United from 1946, Leeds United from 1969 and Arsenal from 1998).
In the Q3 2023 release, we added a new capability to the Pattern Match functionality to allow users to split the transactions into groups before looking for particular matches. This made answering questions, such as this one from the 31st January 2024 column (2) very easy to answer.
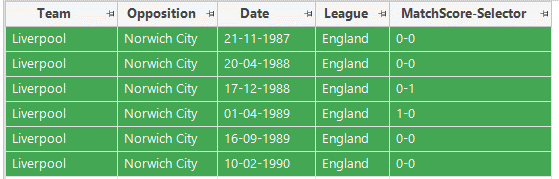
“As the weekend showed, Liverpool v Norwich pretty much guarantees goals, and it got me wondering when they last drew 0-0. It transpires it was 34 years ago in February 1990. Has any other regularly contested match-up gone that long without a stalemate?” asks Jim Hearson.
In terms of league matches between Liverpool and Norwich, this is a total of 24 league matches where there has been at least one goal. Interestingly, in the 6 fixtures before the start of this run, there were 4 0-0 draws and the other two matches were 0-1 and 1-0!
But as we'll find out below, this run is an extremely unnoteworthy sequence!
To be able to answer this question we must first group all the transactions by the Opposition variable so that we consider sequences against each team separately. We need to look for sequences on the MatchScore variable (which we have available as a selector). However, we want to omit the goalless scoreline (0-0) from the list and we can use the 'exclude list' functionality to do this.
The grid below shows the record sequences for each team (as of the conclusion of the 2022-23 season), where that sequence has been at least 85 matches!
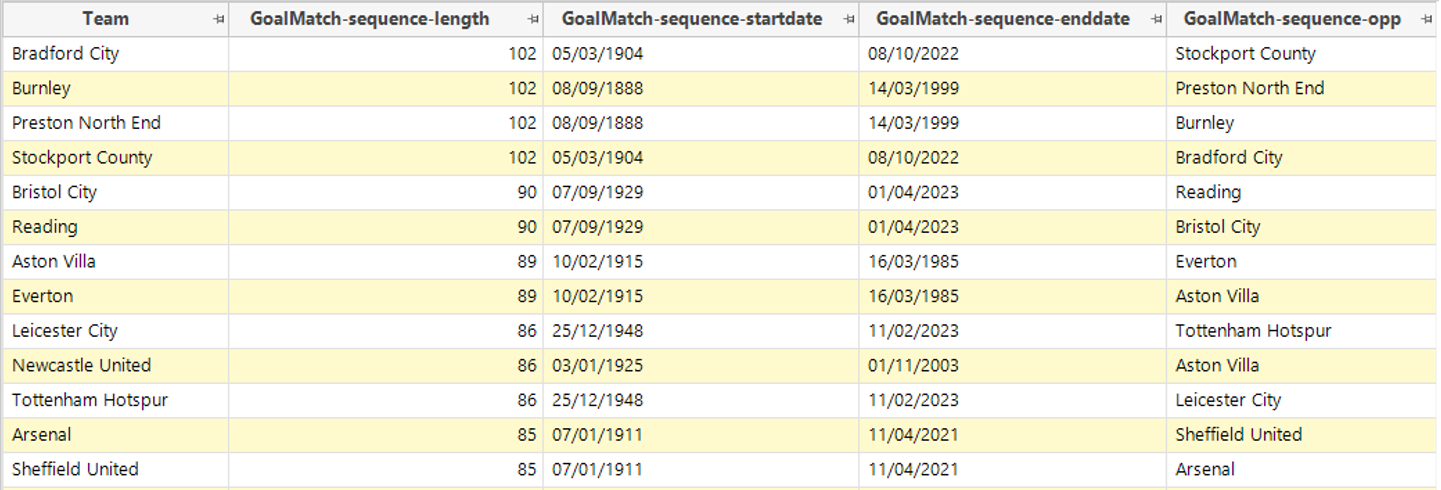
Leicester and Tottenham have played 106 times in total in the league and have only recorded a stalemate once, in their 20th meeting. Since then, they are on a run of 86 matches without a goalless draw. Next season it looks wholly likely that they'll get a chance to increase this sequence!
But this is only the 2nd best ongoing sequence as Bristol and Reading are on a run of 90 matches without a goalless draw. As the league tables currently stand, this one might take longer before they can try and get closer to the record.
The only two longer sequences, standing at 102 matches have come to an end.
On the 8th September 1888, Burnley and Preston North End met in the inaugural season of the football league recording a 2-5 scoreline. This was the first of 102 matches which produced a goal. The sequence finally ended on the 11th September 1999, a run of 111 years.
On the 12th December 1903, Bradford City and Stockport County's first match ended 0-0. But this was to be an anomaly as their next 102 matches produced a goal, but they lost the chance for the outright record on 24th January 2023 when their encounter ended goalless. This is the longest sequence by time at 119 years. These two teams are in the same division in 2023/24 and their first meeting of the current season (on 29/12/2023) also ended goalless.
Segmenting the whole data set
The second common class of questions are ones where we are looking for record breaking teams, where we can arrive at an answer by breaking the data down by multiple variables and using statistics to count the relevant metric and then sort the results appropriately to find the answer.
Let’s illustrate this with some examples.
Back on October 12th 2022, the following question came up (3), ‘Due to the pitch fiasco for Coventry, City are playing five home games in October,” explains Larry Johnson. “Has this ever happened to a league club before?”.
It actually turns out that within the top 4 tiers of English league football this is a particularly unremarkable month, as there have been (up to the end of the 2022-23 season), 1381 times in which a team has played 5 home league matches in a month. In our data, this is firstly a matter of selecting all home league matches, and then using the Tree tool to break them down by ‘Team’ and then ‘Month in which the match was played’ (using the Banded Months option on the Date variable). Simply then sorting the results in descending order shows that there have been 8 teams which have played 7 home matches in a calendar month.
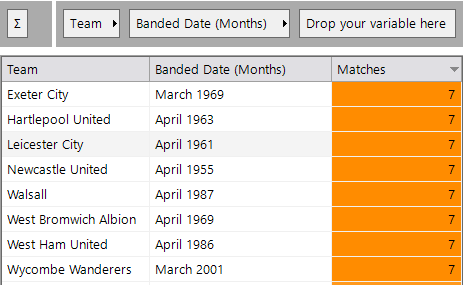
Interestingly, all of these are happening towards the end of the season, which suggests that this was due to fixture postponement earlier in the season. In fact, if we look at all of the months in which 5 home matches were recorded then 673 (or 48.7%) were in April and 304 (or 22%) were in March. There are many instances though of teams earlier in the year having crowded home match schedules (for example there were many teams having 6 home matches in the 1960’s – for example Accrington Stanley in September 1954). As a final piece of interesting trivia only 1 single team has ever played 5 home league matches in the month of November, and that was Cardiff City in 1997.
An example in which we need to use more involved statistics (rather than just counting matches) is this from the 17th May 2023 column (4),
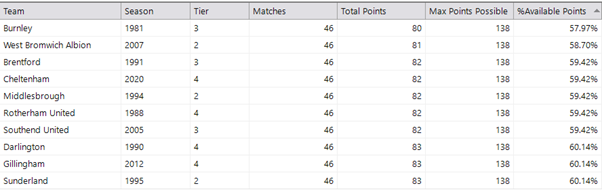
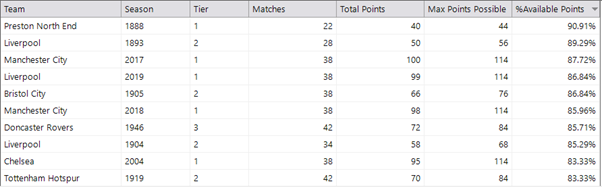
“Dundee won the Scottish Championship with 63 points: 58% of the total points available. What is the lowest percentage of points won for a team to win the league?” (from Stefan Arnott).
In this example, we need to firstly select the seasons in which a team has won the league which we can be done using the ‘Position’ variable that we have already created (referred to in first section). We can then segment our matches by ‘team’ and ‘League-Division-Season’, so we have a single row for each season. We can then total up the number of points won in that season using a Sum(Points for match) metric. We then also need to know how many points were available in that season, and that is ‘the number of matches in the season * points for a win). Finally, a calculated measure of ‘points scored / points available’ and expressed as a % can then give us the desired percentage of points metric. We can then sort this to find the examples of the lowest and highest instances by this metric, as shown in the two screenshots below.
In this section, I’ve given a couple of examples of segmenting the data by variables and then calculating relevant metrics, but this type of question has appeared on numerous other occasions.
Other examples would be:
- What is the worst season in the English league? (5)
- What teams have finished bottom of the table and scored the most goals? (6)
- Has a lowest scoring team ever been promoted? (7)
- What is the most goals conceded by a team with positive goal difference? (8)
Conclusion
I’ve only outlined a small number of solutions to questions that have cropped up in this article but have chosen these ones to illustrate the common techniques which I have to use in order to answer the questions.
The challenges presented each week in the column allow me to test my knowledge and skills, and sometimes this leads to ideas for new features or refinements of existing ones. One such example has been described in this blog post where we can now more easily specify ‘longest sequences’ using a choice of predefined options.
References
- Guardian Football Knowledge column - The Knowledge | Football | The Guardian
- Column from 31st January 2024 - Route masters: football’s shortest multi-divisional stadium-spotting trips | Football | The Guardian
- Column from 12th October 2022 - Which is the biggest English football club without a train station nearby? | Football | The Guardian
- Column from 17th May 2023 - The great escapes: football’s best late-season runs to avoid relegation | Football | The Guardian
- Column from 10th May 2023 – Which teams have endured the least successful seasons in football history? | Football | The Guardian
- Column from 13th December 2023 – Which football teams have been top scorers and finished bottom? | Football | The Guardian
- Column from 6th March 2024 – Which European Cup winners took the shortest time to be relegated? | Football | The Guardian
- Column from 20th March 2024 - Who was the first footballer booked for removing a shirt in celebration? | Football | The Guardian
Get data-driven insights with Apteco
It’s never too late to dive into the world of data analysis. Now you know the benefits data analysis can contribute to your retail business, chances are you’ll wonder why you didn’t get started sooner. Apteco can make data analysis feel second nature, offering a complete picture of your customer data so you can tailor your marketing campaigns to the preferences and needs of each customer segment.
Why not take a look for yourself? Book a demo with our friendly team today to get started.
Want more like this?
Want more like this?
Insight delivered to your inbox
Keep up to date with our free email. Hand picked whitepapers and posts from our blog, as well as exclusive videos and webinar invitations keep our Users one step ahead.
By clicking 'SIGN UP', you agree to our Terms of Use and Privacy Policy


By clicking 'SIGN UP', you agree to our Terms of Use and Privacy Policy
Other content you may be interested in


Want more like this?
Want more like this?
Insight delivered to your inbox
Keep up to date with our free email. Hand picked whitepapers and posts from our blog, as well as exclusive videos and webinar invitations keep our Users one step ahead.
By clicking 'SIGN UP', you agree to our Terms of Use and Privacy Policy