
What is Self-Service Analytics & Why You Should Care About it


Self Service Analytics could be exactly what your business needs to stay agile in times of unpredictability. Making data accessible to all functions of your organization is not just an option anymore, but could be what gives you an edge over the competition. Here's our take on it.
What is Self-Service Analytics?
According to Gartner, “Self-Service Analytics is a form of business intelligence (BI) in which line-of-business professionals are enabled and encouraged to perform queries and generate reports on their own, with nominal IT support.“
The definition is clear – investing in a self service analytics could really bump up your team’s efficiency. But it’s often hard to start a discussion about this because of the R(OI) word. Here’s a gift from us to you – a Free ROI calculator to help you with senior management buy-in.
In order to properly understand the value of self-service analytics, first let’s take a look at traditional BI and how things were done before data analytics had the possibility of becoming “self-serve” so to speak.
Traditionally, there has always been a team of data experts or analysts whose primary job is to crunch numbers, create dashboards and have these ready for business users when they need them.
This process flow does not always work like a well oiled machine. Data analysts take time to make sense of these numbers – time to put them together in a format that is intelligible and (more) time to put them into dashboards that represent relevant metrics and KPIs. So in a situation like this, when a Head of Marketing wants insights on a specific category of products in a specific region that is not part of the predefined dashboards, this becomes an ad hoc request which requires even more time.
So by the time the relevant numbers reach the team, the problem has already been blown out of proportion or blown over. Usually, with collateral damage – which may be lost revenue/credibility or worse, personnel.
Self Service Analytics in the Time of Covid
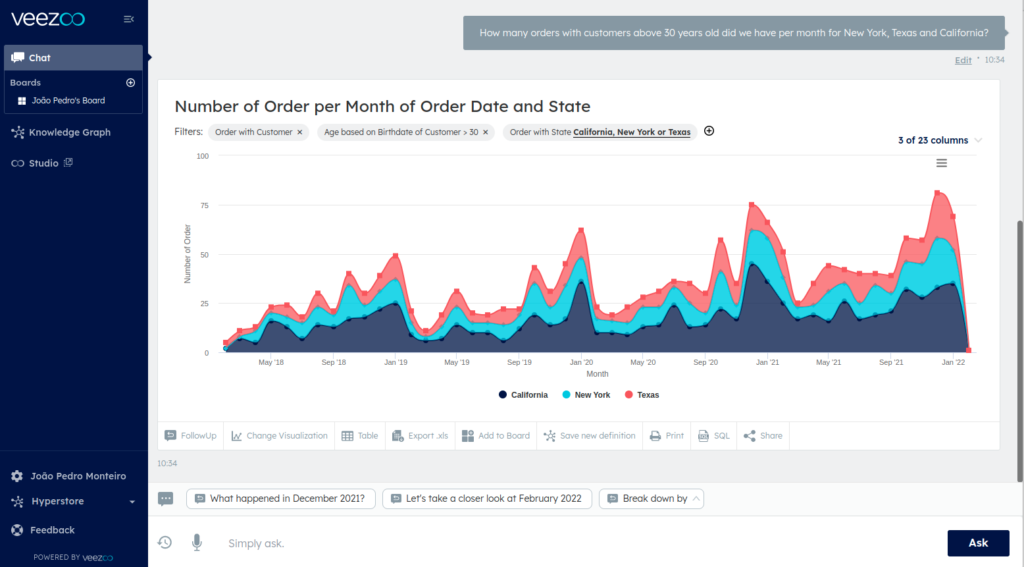
Veezoo’s Chat based UI makes Data Analytics easy
The world is changing – it doesn’t follow predictable patterns anymore. Patterns that traditional BI is well equipped to foresee. Traditional BI is just not enough anymore. Here’s just a small reason why you should consider self service analytics:
The dashboards you created in 2019 couldn’t really help you in 2020, apart from telling you that your KPIs were going down because of the pandemic. The ones you built for the pandemic in 2020 didn’t help you with the supply chain crisis in 2021. And the ones you made for the supply chain crisis in 2021 can’t help you fully understand the situation in 2022 with inflation, a looming recession, war in Ukraine, an energy crisis and God knows what’s coming next (an alien invasion?).
The truth is, if there has ever been a time when self-service analytics was most needed, that time is now. The world is going through an exceptionally volatile period and you need to keep a close eye on how the market is changing. This means all of your data needs to be accessible in a flexible way – not just over a few predefined dashboards that your data team put together months ago when stability was not a factor.
Data is one of the tools (maybe the only?) that can help companies overcome today’s challenges. And it cannot be based on yesterday’s questions.
And that’s why there is such a buzz – across different industries – around self-service analytics tools – because it is about making data more universally accessible and, more importantly, actionable.
What Are the Advantages of Self Service Analytics?

With self service analytics, these problems can be alleviated. How, you ask?
- Removes bottlenecks and saves time: Self-service data analytics tools save time for any organization by removing bottlenecks. Teams don’t work in silos – or at least, they shouldn’t – but collaborate. For the employee, it enables them to be more efficient because it saves time – they need not wait for days to receive the information they need in order to make important decisions.
- Reduces the barrier to entry: For most of these tools, there is no need for technical training or coding skills. Business users can simply usually drag and drop, ask questions or create pivot tables to analyze data. This increased accessibility to data means that business users can come to conclusions the same way a data analyst can. But the difference here is that they can then immediately use this information to make well-informed decisions. Which translates to saved time … and dollars.
- Focus on Core competencies : Data analysts now have more time to focus on tasks that are highly specific to their core competencies and need not always prioritize reports for the business user. And the business user need not spend days waiting to plan their next steps or worse, hours trying to analyze data. Both tech and business teams can now focus on their areas of expertise, which in turn leads to the organization functioning like a well oiled machine.
Sounds like a dream – you save time by eliminating bottlenecks and focus on actioning on your insights. So what’s the problem? Let me address the elephant in the room: Getting senior management buy-in to invest in these tools.
But we have a hack for you – our very own ROI calculator that can help you get the job done. Did you know that even with a small data team of 3 people, you could stand togain over 97% ROI with a basic yearly Veezoo subscription? We did the math, so you don’t have to. All you have to do is populate the values such as pricing of the tool you’re considering or the salaries of your in-house data team and our spreadsheet will do the work for you. Now that we’ve established why any organization would stand to benefit from self-service analytics, it’s time to have a look at the kind of self service analytics tools out there.
Pivot-Based vs Search-Based Self Service Analytics tools
All in all, there are mainly 2 kinds of self-service analytics out there: pivot-based and search-based.
Pivot-based:This is your usual interface. You usually only explore one flat dataset at a time, e.g. orders or meetings. The interface consists of a sidebar with measures (e.g. KPIs like revenue) and dimensions (e.g. products, regions), which you can drag-and-drop to create charts and filter results. The end goal is usually to create a new custom report.
This interface can become easily overwhelming the more dimensions and measures you have. Due to its complexity, this interface is often only used by power users inside a company, while everyone else consumes dashboards with tons of filters that they can set, a.k.a. traditional BI.
Examples: Tableau, Looker, Google Data Studio, Power BI, Holistics.
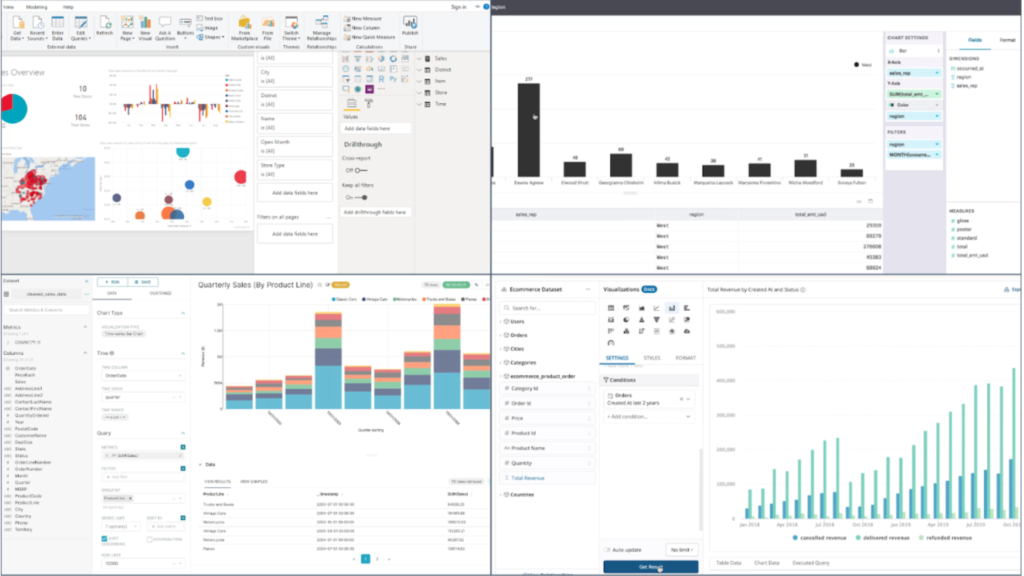
Tool interface for a BI tool
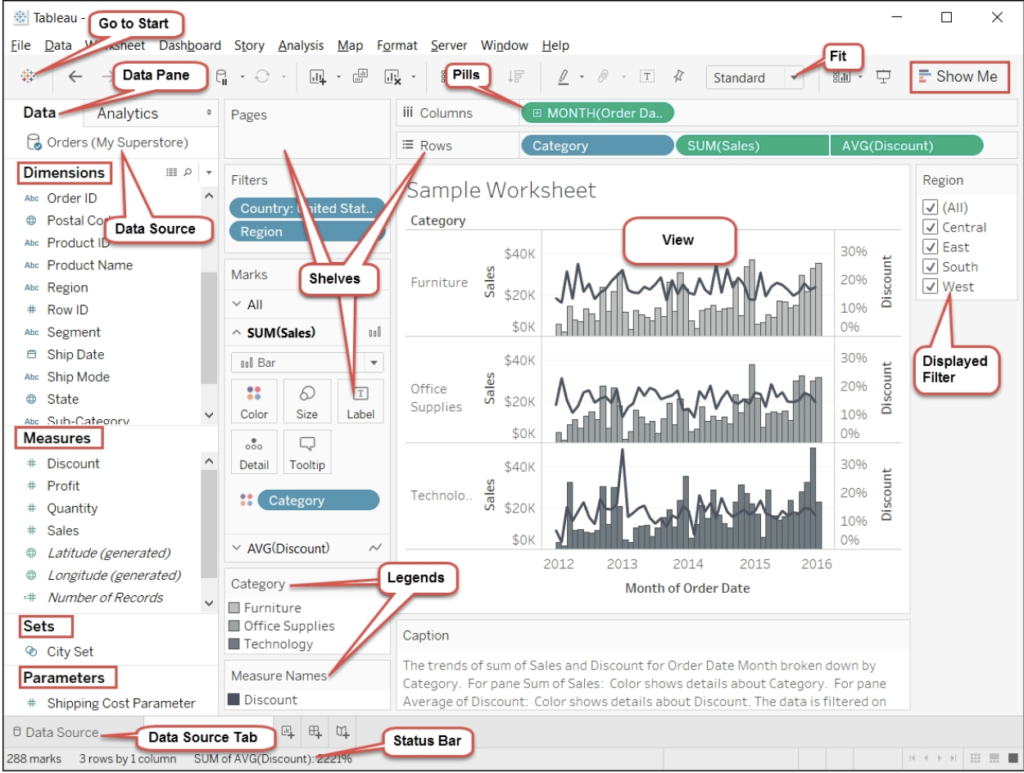
Tool Interface for a Second BI tool
Can you tell these tools apart?
Search-based: A search-based self-service analytics platform or tool provides a Google-like experience for your own data. Instead of looking for the right report or table, setting filters and having to click through a maze of menus, you just search or simply ask a question. You know, like you would normally do when you want to know the actor in a certain movie or the amount of calories in a cream cheese bagel.
The more data and tables you have and the more questions you want to answer, the harder it gets to find the right report for it (traditional BI) or drag-and-drop your way to an answer (pivot-based self-service). If a question comes up in a meeting, would you rather click through 20 different steps or simply search across all your data?
Let’s bring self service analytics closer to home. You may not be in the market for a self-service data analytics platform just yet and that’s perfectly fine. But can you answer questions like this in a few seconds?
- How many customers in the US upgraded to enterprise packages last quarter?
- How many meetings were booked by sales reps per week on average in 2021?
- Which prospects from Fortune 500 companies haven’t you had any touchpoints with in the last 3 months?
Maybe you can. But how many reports did you have to open? Would a new employee even know where to start? Why not?
These are just a few examples of everyday questions which may or may not apply to your team. But regardless of that, if your team has a question which cannot be answered using the reports and data that you allow them to access at the moment it is quite likely that your team may be ready for a self-service analytics platform.
Hear me out – you’re probably thinking that your team has all the insights and information they need at their fingertips to make the most of the data that they already have. And if anything, instead of giving them an additional tool, you need to train them to make the most of all the reports they already have.
We call this the ‘Just Enough Training’ fallacy: a common tendency to try to overcome the mismatch between a tool (traditional BI) and a problem (ad-hoc questions) by investing in training. The truth is: traditional BI is meant to solve the problem of standardized reports for your main KPIs. Trying to use it for ad-hoc questions is the same as trying to use Email (or even worse: a letter!) for instant messaging instead of WhatsApp. That doesn’t mean you should substitute your standard reporting solution with a self-service analytics tool. We still use Email and WhatsApp after all.
With a self-service data analytics tool, your business team can draw up the relevant numbers in minutes without undergoing extensive training. Imagine a scenario where you have an important operational meeting and you need specific, detailed numbers on a new customer segment you are investigating. In a traditional BI setup, you would need to request these numbers from your BI team and re-convene a week later (if your team is very efficient). But with a self-service analytics platform, all you need to do is spend a few minutes during the meeting to draw up the necessary numbers and discuss the next steps after. That’s exactly what happened at Valora. Implementing Veezoo enabled them to reduce ad-hoc requests to their controlling team by 87% and increase their revenue at their individual outlets by 5%.
Want more like this?
Want more like this?
Insight delivered to your inbox
Keep up to date with our free email. Hand picked whitepapers and posts from our blog, as well as exclusive videos and webinar invitations keep our Users one step ahead.
By clicking 'SIGN UP', you agree to our Terms of Use and Privacy Policy


By clicking 'SIGN UP', you agree to our Terms of Use and Privacy Policy
Other content you may be interested in


Want more like this?
Want more like this?
Insight delivered to your inbox
Keep up to date with our free email. Hand picked whitepapers and posts from our blog, as well as exclusive videos and webinar invitations keep our Users one step ahead.
By clicking 'SIGN UP', you agree to our Terms of Use and Privacy Policy