The Essential Guide to Google Analytics: How to Get More From The World's Favourite Analytics Platform
Whether you work on an ecommerce site, blog, app, or pretty much any kind of digital property, it’s important to understand your users or customers and get some insight into how they interact with your site.
Since its launch back in 2005, Google Analytics (GA) has been the de facto choice for web analytics. Dismiss GA at your peril - there is no doubt that it is one of the stalwarts of the modern web. Free to use and easy to implement, with powerful features right out of the box, GA is by far the world's most popular web analytics package, providing insights for tens of millions of sites worldwide.
This guide has been written to help you get more from Google Analytics. Read on to find out how you can get deeper insights into your users, then use this information to shape your content, focus your marketing efforts and prove ROI.
Get the downloadBelow is an excerpt of "The Essential Guide to Google Analytics: How to Get More From The World's Favourite Analytics Platform". To get your free download, and unlimited access to the whole of bizibl.com, simply log in or join free. |

|
Guidelines for UTM tagging
Before we get to the good stuff, it’s important to understand one of GA’s most useful functions (which is also one of its key limitations) - UTM tagging. UTM tagging is a set of parameters which can be appended to URLs, specifically;
- Utm_source
- Utm_medium
- Utm_term
- Utm_content
- Utm_campaign
These can be used individually or in combination to provide extra information to GA concerning the source of traffic when an analytics hit originates via these URLs. For example, if you were running an ad campaign with Facebook, you might use utm_source=Facebook as part of the URL you supply for clicks, giving a url http://yoursite.com/landingpage/?utm_source=Facebook. You then might append some information about the content of your ad, like utm_content=SpringCollection16 to make http://yoursite.com/landingpage?utm_source=Facebook&utm_content=SpringCollection16. This information will then appear in your reports, allowing you to discern what traffic came from where.
TIP:The variables you use are case sensitive, meaning Facebook is not the same as facebook.
TIP: Find out more about the UTM parameters and check out Google’s URL builder to help with link construction.
Tagging is a simple and effective way for marketers to understand where traffic originates, without time-consuming coding or the need to create many iterations of identical pages. There are limitations of the system however - Even if the link is initially masked through a link shortener or vanity URL of some description, ultimately, the UTM parameters will become visible to your site visitors at the point they land on the destination page.

Because there is no mechanism for encrypting (or even hexing) the parameters in GA, the system is open to abuse. Visitors can change their UTM parameters and spammers can visit your URLs, supplying erroneous information which will duly appear in your reports. There is currently no way to comprehensively prevent this. Even if you are capable of individually investigating each spam entry, dropping traffic by referrer, blocking IP addresses, etc, the spammers don't actually have to visit your pages, just run the GA tracking code with your property’s identifier and their own utm information. There is simply no way to prevent this. Worse still, there is no way to retrospectively remove it - once it’s in, it’s in.
TRIVIA: The “UTM” stands for Urchin Tracking Module, which is a hangover of Google’s initial acquisition of the Urchin software company, whose analytics software formed the basis of Google Analytics.
The basics - What do the reports do?
In this section, we’ll look at the main reports in Google Analytics individually - We’ll explain their basic functions and give you some ways to put this information to work.

Intelligence Events
Perhaps one of the most under-utilised reports in GA, Intelligence Events helps you track changes on your website and highlight anything that seems out-of-the-ordinary. If you’re wondering why that’s useful, some built-in examples include;
- A spike (or drop) in visits to a particular page: This can be useful if one of your articles has been linked to in the news, or if you had experienced some negative sentiment concerning a product you sell.
- Overall drop in pageviews: Possibly because of some algorithm change by search engines, meaning that your current or future content will need to be adjusted.
- Significant change in bounce rate: If you’ve been creating engaging content and visitors are spending more time on your site.

Explore the Intelligence Events report to work out what insight you could get from GA’s automatic alerts, then consider creating your own, using custom alerts. Some ideas might be:
- Social media spikes: Highlights when a particular piece of content or general activity performs well, to help inform social strategy. Better still, it lets you understand social sharing and viral success.
- Referral traffic changes: A significant change in referral traffic is almost always worthy of investigation. Whether a site is linking to you, bringing new users, or perhaps your SEO needs attention, following some disappointing organic referrals.
- Significant increase/decrease in goal conversions: Events like this can help you identify when your marketing campaigns (such as AdWords) are suddenly not performing in the same way - perhaps a competitor is bidding higher than you, or a change to your website is preventing users completing transactions (more on goals later!).
Custom Alerts
You can have GA alert you when it detects intelligence events. Custom alerts can be created and managed from the dedicated tab in any of the Intelligence Events sub-reports. To create a new alert, simply click “New Alert”, give it a name, select the view (site) to be monitored and the time period, tick the “Send me an email when this alert triggers” then choose the conditions under which you would like an alert to be generated.
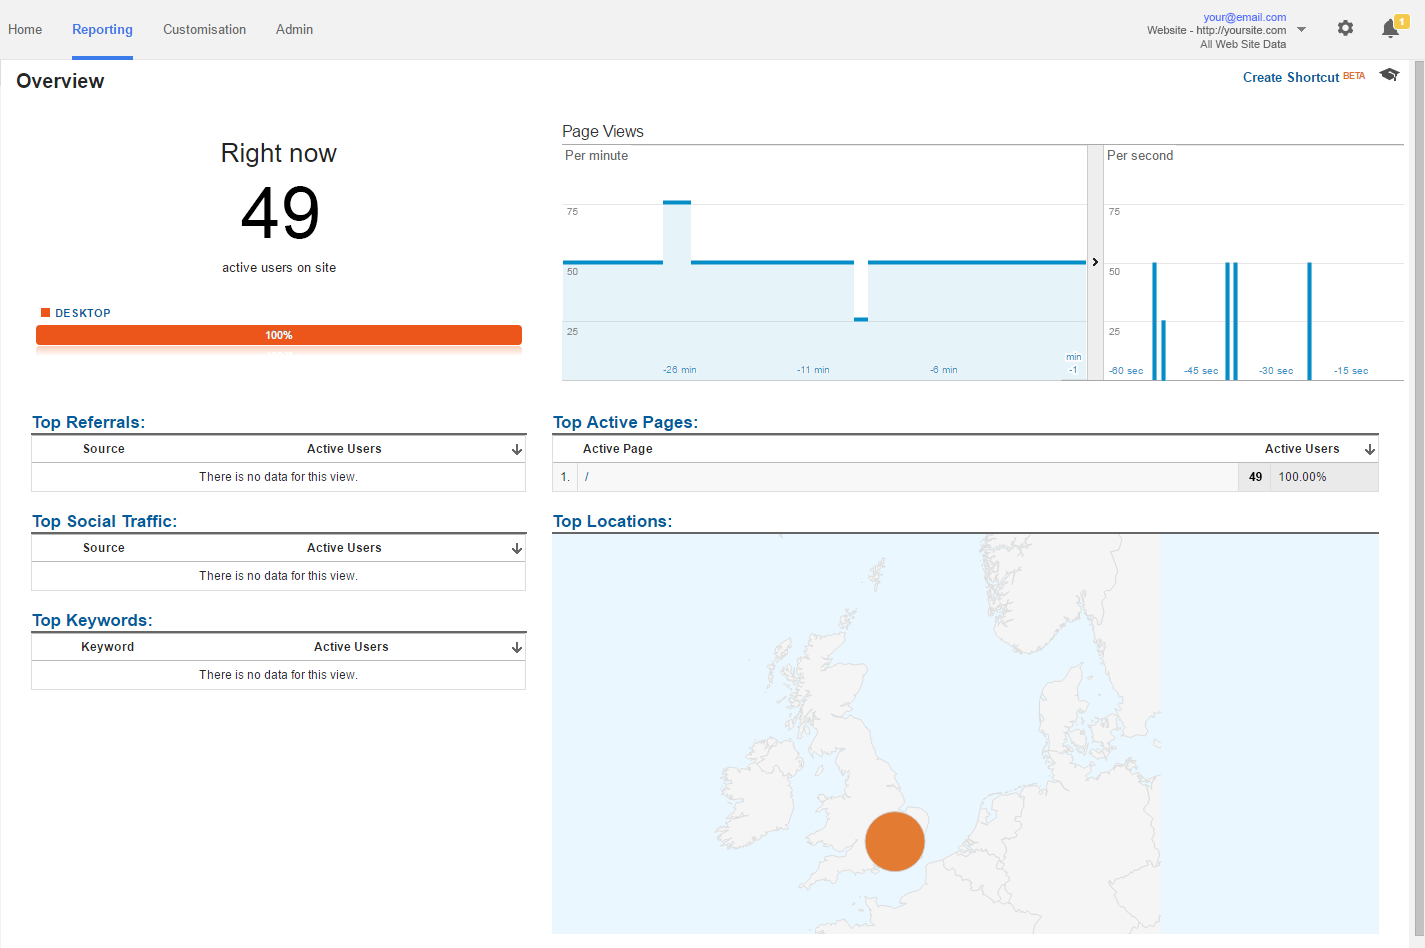
Real Time
As the name suggests, the Real Time report allows you to see live information pertaining to active users on your site. As they appear and drop off, the report will be constantly updated. Unsurprisingly, Google is having to process the incoming information as it happens, so some metrics aren’t available in real time, but it can still be a useful tool. Many companies use this report on screens around the office as it helps to bring the website to life.
Common applications of this report include:
- Hardware load monitoring
- Live intelligence event tracking,
- Testing (including UTM parameters and intelligence events)
- Time-sensitive marketing activity, such as social media performance tracking.
Those who use GA to monitor mobile apps should be wary of real time, as it batches client-side hit information to conserve battery.
Audience
The Audience report gives insights into who’s using your site or app, where they are, what devices they use, which browsers, languages, and more. This information is useful in understanding your audience and ensuring that your site works well for as many of your users as possible.
Newer functions include the User Explorer section, which allows you to drill down and look at timelines on an (anonymised) per-user basis.
Demographics and Interests provide some (fairly limited) insights into the age and gender of users and some slightly more useful information on interests, which can be used to shape content and identify user affinities.
Cohort Analysis
For those unfamiliar with the term, “cohorts” are simply groups of people who, for the purposes of this type of analysis, are normally grouped by the date of their first session on your site. So, if someone first visited your site on the 1st of May 2016, they are part of the 1st May cohort, as well as the May 2016 cohort, the 2016 cohort, etc. In GA, Cohort analysis can be conducted across many metrics such as page views, sessions and goal completions.
Such information can be particularly helpful in measuring loyalty, retention and marketing performance. For example, if we run a marketing campaign offering free delivery for a year to anyone who signs up to our website during a particular week, we might expect to see more visits from that cohort in the next 12 months.
Want more like this?
Want more like this?
Insight delivered to your inbox
Keep up to date with our free email. Hand picked whitepapers and posts from our blog, as well as exclusive videos and webinar invitations keep our Users one step ahead.
By clicking 'SIGN UP', you agree to our Terms of Use and Privacy Policy


By clicking 'SIGN UP', you agree to our Terms of Use and Privacy Policy
Acquisition
The Acquisition reports show you where your traffic is coming from. They are undoubtedly some of the most powerful reports available in GA. With the information on offer here, it’s possible to understand what’s working and what’s not at a glance. Without complex number crunching, the Overview section shows you which channels your visits are coming from, and gives you the ability to drill down into each.

In Organic Search, such “drill-down” information has become fairly useless since Google started withholding keyword information in 2011, but in other reports, including Paid Search, Direct, Referral, Social and Email, the data can yield useful information to help marketers direct their efforts. The Overview report also allows you to compare channel performance by goal completions and (where they’ve been set) goal values.
Worthy of special mention is the “Other” channel. If you’ve been observing good tagging discipline, your Sources (utm_source) will show up here. Further filtering using the Secondary Dimension drop-down allows you to see Medium and Source which, in turn, allows you to visualise best performers.
Search Console
Linked to the Google’s dedicated Search Console application, the Search Console section of GA allows you to understand traffic originating from Google’s search properties, making it a key report for SEO. Every sub-report of this section leads with “Impressions”. Unlike the impressions referred to by media buyers, an Impression here is where a URL from your site or app appears in Google search results. It does not relate to a click or a page view on your own properties.
The Landing Pages section of the Search Console report allows you to order your individual pages by;
- Impressions: the number of times the page appears in Google’s search results (on any page).
- Clicks: the number of times the result is clicked.
- CTR: the number of times the result is clicked vs the number of impressions, given as a percentage.
- Average Position: The average search rank of the page in search results.
Similar metrics are available in the other sub-reports of the search console, which allow you to gain insight into countries and devices. These reports can be particularly useful if you operate a property in more than one language or geography, particularly if search is a strong part of your acquisition strategy.
Social
As you might imagine, the Social report gives insight into sessions referred by social networks. Helpfully, GA includes a “Social Value” chart in the overview page, helping you to ascertain whether social visits are truly offering you any benefit (and possibly ROI).
The Assisted Social Conversions metric here allows you to see how many goals are achieved from people who came via social at some point (rather than necessarily the visit during which they completed the goal). It’s also worth noting that Conversions refers to your whole site, not just social - it’s there for context.
Other sub-reports here help you drill down into which networks are referring, what pages traffic is landing on and how well these visits are converting. You can even track interactions with social plugin buttons, such as Facebook’s “like” or Twitter’s “tweet” buttons.

Campaigns
When it comes to measuring the effects of your outbound marketing, the Campaigns section is crucial. As with many of the GA reports, there is overlap with Acquisition so, again, your tagging discipline is important here. For non-AdWords-generated sessions, all your “utm_campaign”s will be listed here. For AdWords users, unsurprisingly, the campaign names you set also appear.
This report is useful, as it provides a unified overview of all your outbound activity, no matter where it comes from. No more signing into different systems to slowly piece data together and compile lengthy spreadsheets! From the All Campaigns overview, you can see the number of sessions generated per campaign, as well as the conversion rate for each.
Behaviour
The Behaviour reports look at what your visitors do when they’re on your site, including what URLs they visit, how long they spend on each, their use of site search and the speed that pages are delivered to them. One of the key sections here is the Site Content sub-report, which allows you to understand your most (and least) popular pages and what pages people are landing on and exiting from. This can help you focus your content, as well as identify issues with particular pages - for example, if you find a large chunk of your traffic is leaving on a particular product page, that might be because the price is too high, or if they are leaving on your sign-up page, it could highlight issues with the amount of data you’re asking for.
Behaviour Flow
Perhaps the most powerful sub-report of Behaviour is Behaviour Flow. This gives a visual representation of users movement through your site, allowing you to identify bottlenecks and problem pages, as well as high-performing content or events.
From left to right, the flow representation shows your choice of dimension (the default being “landing page”), then the grey lines represent how users flow from page to page. Thicker lines mean more users and red downward highlights represent drop-offs.

- High drop-off rates: High drop-off rates from individual pages (as denoted by red, downward highlights) can be an indicator of poor content or poor user experiences - issues such as broken links or lengthy forms can often be to blame here. Even if drop-offs are occurring at “expected” pages, such as event confirmation or “download complete”, look to add suggested products or content in order to generate a few more page impressions.
- Unexpected journeys: By clicking pages and selecting “highlight traffic through here”, you can use the report to isolate journeys which touch a specific page. By analysing the connections, you can identify unexpected journeys and highlight potential user experience issues - look out for error pages, such as 404. Pay particular attention where users are abandoning predefined journeys, such as basket-to-checkout or registrations.
Conversions
Although goal-based conversion information is present in most of the other reports, the Conversions section provides a holistic overview. It’s particularly useful for ecommerce; if you’ve implemented ecommerce tracking (an extra code snippet that needs to be included in your pages), you can get extra information pertaining to actual order values, as opposed to notional goal values. Whether or not your app or site is commerce-focused, the Conversions sub-reports can help you analyse your conversion path and optimise your customer journeys. They also allow you to analyse what sources are feeding each of your goals in reverse, or visualise your customers moving down a predetermined funnel.
Creating better Dashboards
Dashboards make it easy to collect pertinent information from relevant reports into a personalised view to suit your needs. By their nature, there is no one-size-fits-all dashboard, but GA does provide some examples contributed by Google and others in their Gallery. The secret to creating better dashboards starts with the needs of your internal audience and their understanding of analytics. The dashboard your marketing team requires will probably be very different to the summary that your board will find useful.
Dashboard Examples
Social Media Overview
A dashboard like this will give you an overview of your social activity, and an immediate understanding of your social ROI without the need to manually collate a report. Include metrics like;
- Overall site visits from social
- Top landing pages for social referrals
- Total revenue from social
- Top social referrers
Gender Comparison
Particularly useful for fashion ecommerce retailers, a gender comparison dashboard could offer insights into product category and marketing performance by gender, without having to apply two different filters to each report and manually collate the results. You could include metrics like;
- Split of male and female users
- Top content pages for men and women (as separate widgets)
- Top traffic sources for men and women (as separate widgets)
- Average revenue for men and women (as separate widgets)
A library of contributed dashboards is accessible from within the New Dashboard dialogue. Unsurprisingly, with millions of GA users around the world, whatever the dashboard you are trying to create, you’ll likely find something suitable here. From SEO to eCommerce and everything in between, there are over 100 thousand dashboards available, which can be imported with just a few clicks, then customised to your needs. Some of the most popular include;
- Avinash Kaushik’s “Occam’s Razor Awesomeness”
- The GA team’s own “New Google Analytics User Starter Bundle”
- Vagelis Varfis (Nudge Digital)’s “Content Analysis Dashboard”
All of which include a selection of segments, custom reports and dashboards designed to unify the information in a useful way. Users should remember that dashboards can be edited or deleted without restriction, so as well as it being possible to experiment without fear, they are also effective for more temporary uses, such as specific campaign monitoring or short-term monitoring of specific content or products. Lastly, reports can be exported, so if you find they work for you in one GA property, you can apply them to others, or share them with colleagues.
Content Experiments - Intermediate to advanced users
A/B tests are an excellent way to understand how different page design elements and messaging help (or hinder) your website. GA’s Content Experiments is a split-testing tool which presents two different versions of the same page to a sample of traffic to see which version converts better. Whilst the premise is fairly simple, actually putting an experiment in place is one of the more complicated features of GA:
- Firstly, outside of GA, create two or more pages (normally within your CMS) or make a note of the URLs.
- Secondly, within GA, set up a goal which is the common objective of both pages - normally a sale confirmation or registration event
- Next, under Behaviour, click Experiments, then click “Create experiment”
- Use the “select a metric” dropdown to select your goal, then select a percentage of traffic to run the experiment on and hit “Next Step”
- Paste your URLs into the boxes, and add further variants as required and hit “Next Step”
- Select “Manually insert the code” and follow the instructions to add the code to your pages and hit Next Step.
- Lastly, review and start your campaign - GA will do the rest. Reports are available in the Experiments report for running or complete experiments.
IMPORTANT: inserting the GA experiment code into your pages requires intermediate to advanced HTML knowledge. If actioned incorrectly, reporting may fail, or worse, experiments may direct users to broken pages.
How to use segments
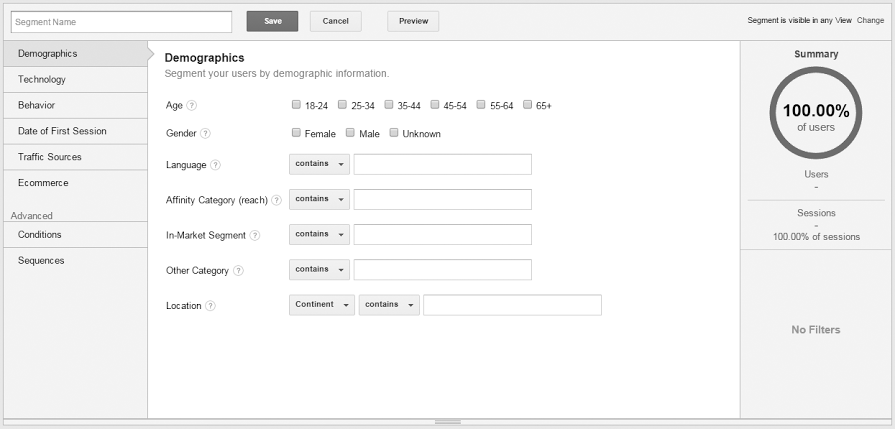
Segments are simply a way to isolate subsets of data within your Google Analytics property. These segments can then be compared to each other, compared to the rest of your data, or simply analysed in their own right.

Creating a segment is a relatively simple task using GA’s segment-builder. Once you’ve defined the subset, using either the standard information (Demographics, Session Properties, Traffic Sources, etc.) or advanced conditions (such as UTM string matches and more), most reports in GA give the option to add them for comparison.
Some particularly useful built-in segments available include:
- Mobile Traffic - will help you understand how mobile users move around your site/app. This can be especially insightful when compared with other traffic, allowing you to understand where users behave differently, which can help discover usability issues or poor performance.
- Paid Traffic - can be used to understand if traffic originating from paid sources performs differently to (for example) organic traffic. This information can help you make more accurate calculations about the ROI of visitors originating from paid channels.
There are many other built-in segments, as well as a curated library available for free download (accessible via the “Import from gallery” button in the segment creator). As with many things in GA, it’s important to assess your own needs in order to create segments that address them.
Attribution Modelling
For the uninitiated, the term “attribution model” refers to the rule (or set of rules), by which you attribute the credit for achieving a particular goal in a conversion path. For example; a customer might visit your website or be exposed to your brand multiple times, before actually making a purchase (which is the goal). The model decides how you give credit (or not) to the channels which played a part. After years of DIY attribution, Google Analytics now has some reasonable attribution modelling capabilities, which can be found in the Conversions report.
Setting up: Goals
Goals are simply a way to quantify and measure your web properties’ objectives. For ecommerce retailers, a goal might be an order confirmation page, whereas for brands, it might be an email signup page. Other examples include enquiry forms, booking confirmations, time spent on site, or even media views. Unsurprisingly then, it’s important to have considered and defined your goals before thinking about how to attribute credit for reaching them! Happily, GA provides a simple wizard for setting these up, including templates for most common goals.
Set up and manage goals in Conversions > Goals > Overview

It’s important to remember that the final action (e.g. a confirmation page) is not necessarily the only goal - just adding a product to a basket can be the first goal, followed by another when visiting the checkout page, etc.
Want more like this?
Want more like this?
Insight delivered to your inbox
Keep up to date with our free email. Hand picked whitepapers and posts from our blog, as well as exclusive videos and webinar invitations keep our Users one step ahead.
By clicking 'SIGN UP', you agree to our Terms of Use and Privacy Policy
By clicking 'SIGN UP', you agree to our Terms of Use and Privacy Policy
The default attribution models in Google Analytics
Because your selection of model makes no difference to the underlying data that GA collects, you don’t have to pick just one model. All models are available for you to look at, and you can even compare data from different models - but what do they all mean?

Last Interaction: The last touchpoint before the goal was achieved is given 100% of the credit.

Last Non-Direct Click: In this model, direct traffic (where the visitor types the URL of your website and is not driven by any particular marketing activity) is ignored and all the credit is awarded to the last channel that the customer arrived from indirectly (a display ad for example).

First Interaction: Again, as the name suggests, first interaction awards all the credit for achieving a goal to the first touchpoint; the interaction which “woke a consumer up” to your brand or product(s).

Last AdWords Click: As the name suggests, this model is only useful if you’re an AdWords user, attributing all credit for achieving a goal to the last click on a paid Google AdWords campaign.

Linear: The linear model attempts to recognise all contributors to a goal event. Each channel that caused a customer to interact with your site/app is given equal credit for the eventual conversion, with no weighting given to the first, last or any contributor in between.

Time Decay: In the Time Decay model, credit is awarded to all contributors based on their proximity to the final conversion. Thus, if there was an interaction immediately preceding a conversion, it would garner significantly more credit than an earlier interaction (perhaps the first) a week previously.

Position Based: The Position Based model specifically attributes 40% of the credit for a conversion to the first interaction and 40% to the last. The rest is awarded evenly to any interactions in between.
There is much debate over the validity of certain models and which models truly offer actionable information. If you are beginning to expand on this using the import or API features, or if you simply feel that the models aren’t reflective of your typical marketing funnels, GA provides the functionality to create your own.
Going Beyond Google Analytics
For all its positives, of which the price (or lack thereof) is probably the most compelling, Google Analytics is not without its limitations: The free version does make some compromises, particularly when it comes to analysing large datasets on-the-fly. Drawbacks include:
Sampling
In order to reduce the compute capacity required to generate reports in a timely manner, when dealing with more than 500,000 sessions, Google Analytics will use randomised samples. This limit is reduced to 100,000 sessions in flow visualisation reports. Sampling is essentially where GA analyses a smaller set of data, then extrapolates the results to make up the report. GA also has a hard limit of 10 million hits per property, at which point Google will likely contact you to upgrade or require that you implement outbound sampling so that your site is feeding them less information.
Support
Other than the forums and support pages, the free version of GA provides no business-grade support. This is not an insurmountable issue by any means. Due to its accessibility and prevalence, many third parties are capable of providing set-up and ongoing support, plus there is a staggering amount of information available online.
Frequency of Updates
Perhaps one of the most frustrating issues with GA is consistency and updates. As with most of their products, Google will often introduce changes and make updates without warning. Undoubtedly, the vast majority of these are improvements, but the ad-hoc, zero-notice way in which this often happens can cause issues, or leave users unaware of added functionality.
There are plenty of other analytics solutions on the market, which focus on a particular area (head mapping, lead tracking, A/B testing etc) most of which can be run concurrently with GA to provide an additional layer of reporting.
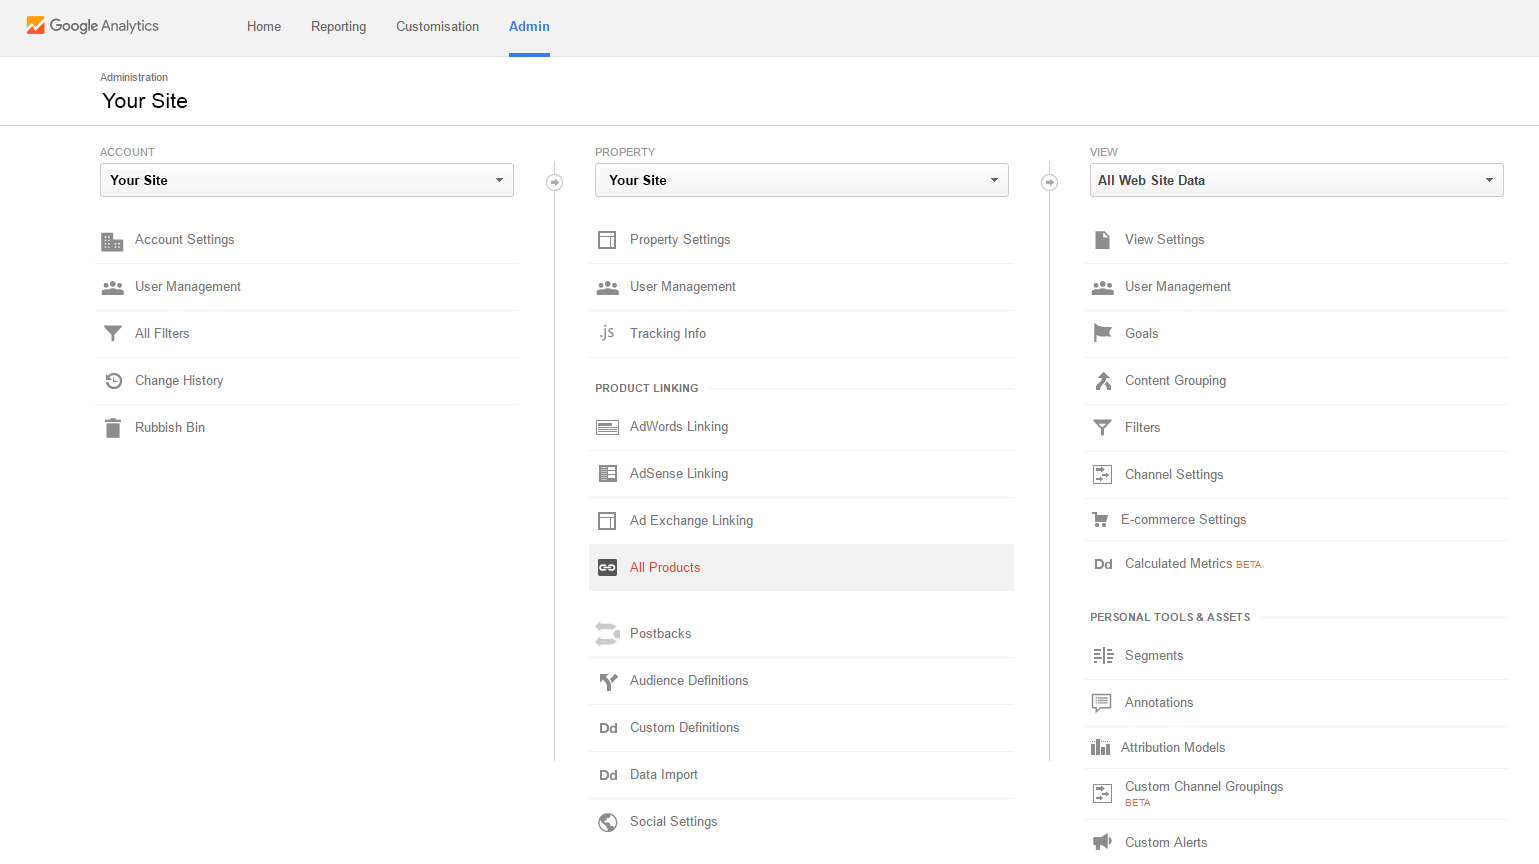
Integrating GA with other services (Google and others)
As you might expect, GA integrates easily with other Google services, particularly advertising. You can see all the built-in integrations in the property column of the Admin section.
APIs for GA are also available, with the “Reporting API V4” currently being the most advanced and comprehensive way of gaining access to the data collected by the platform. It is also possible to export data from within the GA UI on a single report basis. However, if you require access to the raw data, your options are much more limited in the free version of GA - you’ll need to build custom code to suck data out via the API, which is, of course, subject to use limits.
TIP: There is nothing that prevents the UTM tags used by GA from being collected by your own apps or sites. Although not strictly an “integration”, if you’re supplying (for example) Utm_Source information to GA, it can be useful to collect this at the point of email newsletter sign-up or account creation.
Google Integrations & Companion Software
Google Analytics integrates with other (Google) platforms, including the various advertising solutions; AdWords, AdSense, Ad Exchange and DoubleClick, as well as Big Query for data analysis and Postbacks (which allows goal information to reach third party software). There are also a number of tools, which help you gain a deeper insight when used alongside GA. Some of the more important tools include;
Tag Manager
Google Tag Manager allows marketers to insert and manage tags without editing code or involving IT/web operations. “Tags” are short snippets of code, which are inserted into the top of web pages, the two most common uses of which are to affect the behaviour of the page, or report user activity to a third party application (such as Google Analytics). Although Tag Manager does not integrate with GA, it can be used in conjunction with it to quickly insert and manage event tracking tags.
AdWords
AdWords, Google’s pay-per-click advertising platform, is one of the most common paid search options used by businesses of every size. Linking your GA property to your AdWords accounts has several benefits, including;
- The ability to view your website’s performance and engagement data from GA in AdWords,
- Import GA goals and transactions into AdWords,
- Create remarketing lists in GA for use in AdWords,
- View AdWords click/cost data in GA where appropriate
Perhaps most importantly, using the built-in GA reports, you can understand the behaviour of users who visit your site from AdWords clicks and how engaged they are, with metrics such as time spent and bounce rate. Using this information, you can get an indepth understanding of your ROI, not just cost-per-click.
Search Console
Search Console, formerly Webmaster Tools, is a tool for webmasters to understand how Google perceives their site(s). The console offers information on how, and for what keywords, Google indexes your pages. It also offers information on organic search traffic referrals, links to your site and general information about how Google crawls your site. Linking the search console to GA brings some of this information directly into your analytics reports. One of the biggest benefits of this is simply that you don’t need to use external software to prepare reports manually. For further information on the Search Console section of the Acquisition section .
Google Analytics vs Google Analytics 360 Suite
The jump from Google Analytics to the Google Analytics 360 Suite requires some real consideration. Google has clearly positioned the 360 Suite for the enterprise market, and its $150k annual price tag serves as an unashamed reminder of that. The Suite is actually a collection of products, only one of which is GA 360 (Previously Google Analytics Premium). The stand-out differences in GA 360 though, include:
- Raw data export functionality
- Higher (virtually unlimited) limits for analytics hits
- Ability to include multiple properties in single reports
- Higher limits on segments
- Greatly improved SLAs
- Enterprise grade support/training/implementation assistance
- Enhanced attribution modelling
- Much higher session limits for unsampled reporting
Summary
It’s clear then, that Google Analytics is a capable solution that can offer you a wealth of insights. Considering how easy it is to implement and the fact that it costs nothing to run, it’s an obvious choice for all but the largest online properties.
How deep you delve however, and what you do with the resulting information, is very much up to you. Even at the most basic level, the platform can help you create better content, detect issues with your site and improve usability, but perhaps the most important thing to consider is how to put this insight to work for your business.
About Technology For Marketing (TFM)
Find the right technology to transform your marketing and grow your business by attending the Technology for Marketing (TFM) event.
Taking place 28-29 September at Olympia London, expect to be wowed by experiential content exploring your tech DNA, see killer keynotes from top brands, and get specialist training and tech demonstrations tailored to your needs.
What's on?
- Over 100 marketing tech providers - the widest range at any UK event
- Watch 8 keynotes from those leading the way in marketing and technology – including content evangelist Joe Pulizzi and Eventbrite Co-Founder & CTO Renaud Visage
- The opportunity to network with over 8,000 other senior marketers
- 5 conference theatres giving you practical tips and takeaways on everything from data and analytics to search and email marketing
Want more like this?
Want more like this?
Insight delivered to your inbox
Keep up to date with our free email. Hand picked whitepapers and posts from our blog, as well as exclusive videos and webinar invitations keep our Users one step ahead.
By clicking 'SIGN UP', you agree to our Terms of Use and Privacy Policy
By clicking 'SIGN UP', you agree to our Terms of Use and Privacy Policy
Other content you may be interested in


Want more like this?
Want more like this?
Insight delivered to your inbox
Keep up to date with our free email. Hand picked whitepapers and posts from our blog, as well as exclusive videos and webinar invitations keep our Users one step ahead.
By clicking 'SIGN UP', you agree to our Terms of Use and Privacy Policy
Brought to you by